U.S. stocks might find some relief this week, analysts say, but that doesn’t mean this late-summer selloff is over.
Rather, any bounce will likely be a reprieve before the S&P 500 SPX continues its slide toward 4,200, the next major support level for the index, technical analysts said.
In a handful of research notes shared with MarketWatch on Monday and over the weekend, technical strategists noted that several indicators suggest the S&P 500 and Nasdaq-100 have reached “oversold” territory.
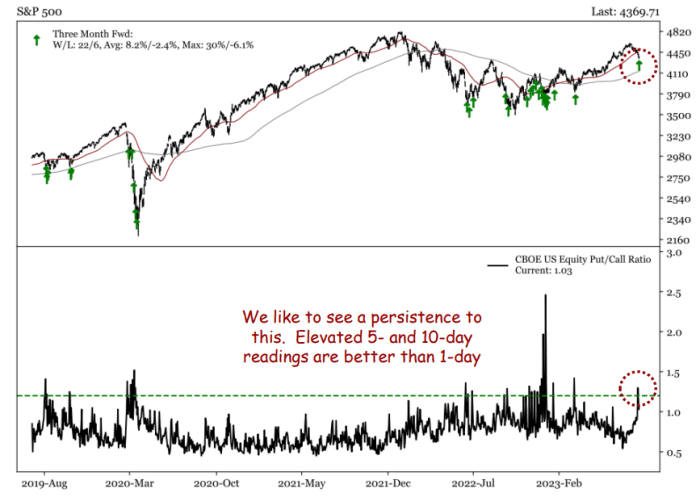
For example, as of Friday’s close, just 15% of S&P 500 stocks were trading above their 20-day moving average, something cited by BTIG’s Jonathan Krinsky and Jeffrey deGraaf of Renaissance Macro. Here’s a chart below courtesy of deGraaf and his team:

Both deGraaf and Krinsky cited the 10-day U.S. equity put-call ratio, which recently spiked to its highest level of 2023 as traders have loaded up on put options, which typically pay off when stock prices decline.

However, Krinsky cautioned his clients to stay focused on the long-term picture, arguing that the selloff is likely only halfway over.
Any bounce should peter out around 4,450, he said, while technical strategists are eyeing 4,200 on the S&P 500 as a reliable long-term support level. Readers may recall that 4,200 served as a durable ceiling for stocks for more than six months.
“While there are reasons to expect some near-term relief, we think the selloff is only about halfway done,” Krinsky said.
Others offered a similar assessment, including Katie Stockton, founder and managing partner of Fairlead Strategies, who said she expects the S&P 500 to find a floor just below 4,200. At that level, stocks would have erased most of their year-to-date gains. The S&P 500 was up nearly 20% for the year at its highs last month, according to FactSet data.
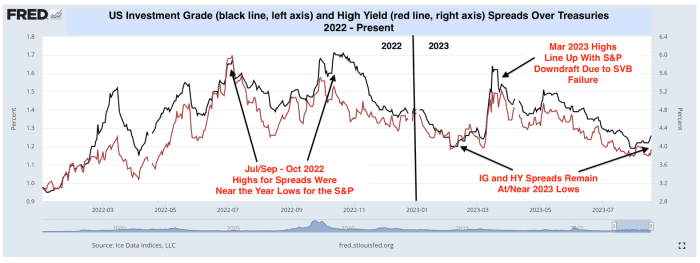
Another development that has raised eyebrows: the spread between Treasury yields and yields on corporate bonds has remained remarkably subdued, something that differentiates this latest selloff from when stocks fell to their 52-week lows in October, as well as the March ructions following the collapse of Silicon Valley Bank.
Nick Colas of DataTrek pointed out in a Monday research note that “at 1.26 percentage points over Treasurys for investment-grade corporates and 3.95 points for high-yield bonds,” spreads for corporate bonds remain “remarkably low.”

That suggests that investors are simply reining in equity valuations from levels considered by many to be stretched, based on expectations for corporate earnings.
The forward 12-month price-to-earnings ratio for the S&P 500 stood at 19.4 in late July. That was higher than the five-year average of 18.6 and the 10-year average of 17.4, according to FactSet data. The index’s decline over the past three weeks has brought it to more manageable level of 18.6, in line with its five-year average.
“The disparity this month must come down to something that is unique to stocks, and that is equity valuations,” Colas said.
To be sure, investors will be keeping a close eye on corporate bond spreads, especially as long-dated Treasury yields march higher. Any sign that they are moving higher could signal that bond investors are starting to fret about rising borrowing costs eating into corporate cash flows and profits, analysts said.
U.S. stocks finished mostly higher Monday, with the Nasdaq Composite COMP snapping a four-day losing streak. The tech-heavy index gained 206.81 points, or 1.6%, to 13,497.59. The S&P 500 increased by 30.06 points, or 0.7%, to 4,399.77. The Dow Jones Industrial Average DJIA, meanwhile, fell by 36.97 points, or 0.1%, to 34,463.69. The S&P 500 and Nasdaq have recorded three straight weekly declines.
This week is rife with potential risks for stocks, including a speech from Federal Reserve Chairman Jerome Powell and an earnings report from market darling Nvidia Corp. NVDA, -3.01%.
https://www.marketwatch.com/story/u-s-stocks-may-bounce-this-week-but-summer-selloff-is-only-halfway-done-analysts-warn-2da503c9?mod=home-page


