
Key Takeaways
- Exchange Netflow fell from +3,507 BTC on August 14 to +683 BTC on August 15; incomplete August 16 data was near +682 BTC.
- Funding dropped nearly 80%, but Open Interest fell less than 1%.
- Exchange reserves have moved above their 200-day trend.
- U.S. spot Bitcoin ETFs recorded $248.4 million of three-day outflows.
- Immediate pressure has eased without confirming stronger demand.
Netflow and Funding Cool, but Leverage Remains
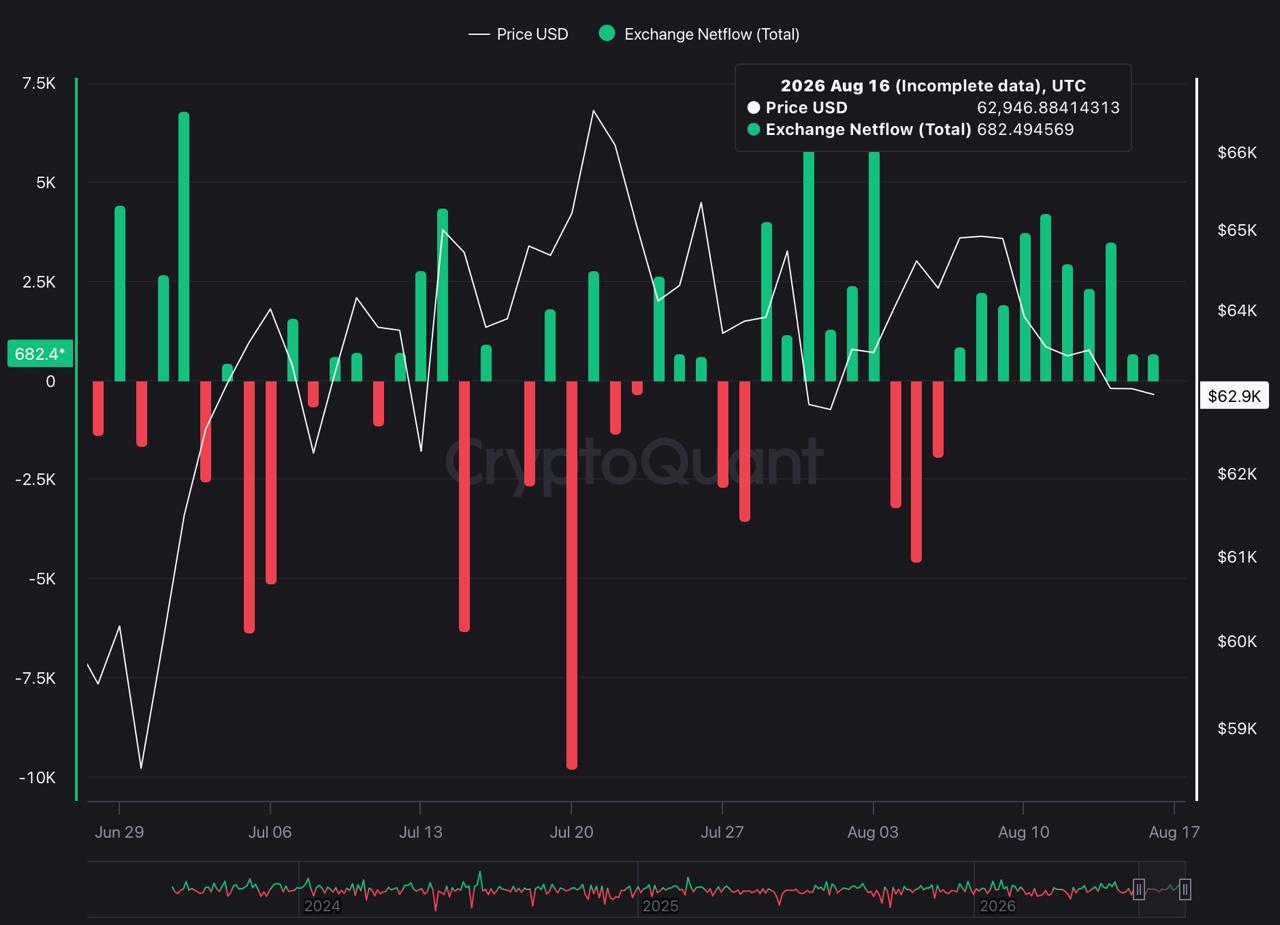
That reduces the strain created by expensive long positioning without amounting to broad deleveraging. It also says little about spot demand. The market became less stretched because net exchange inflows and funding fell, not because buyers clearly became more aggressive.
Daily Inflows Faded; Exchange Inventory Did Not
Netflow and reserves answer different questions. Netflow measures how an exchange balance changed during a period. Reserves measure the total BTC already held on trading venues. A smaller positive daily flow can therefore coexist with a larger exchange inventory built during earlier sessions.
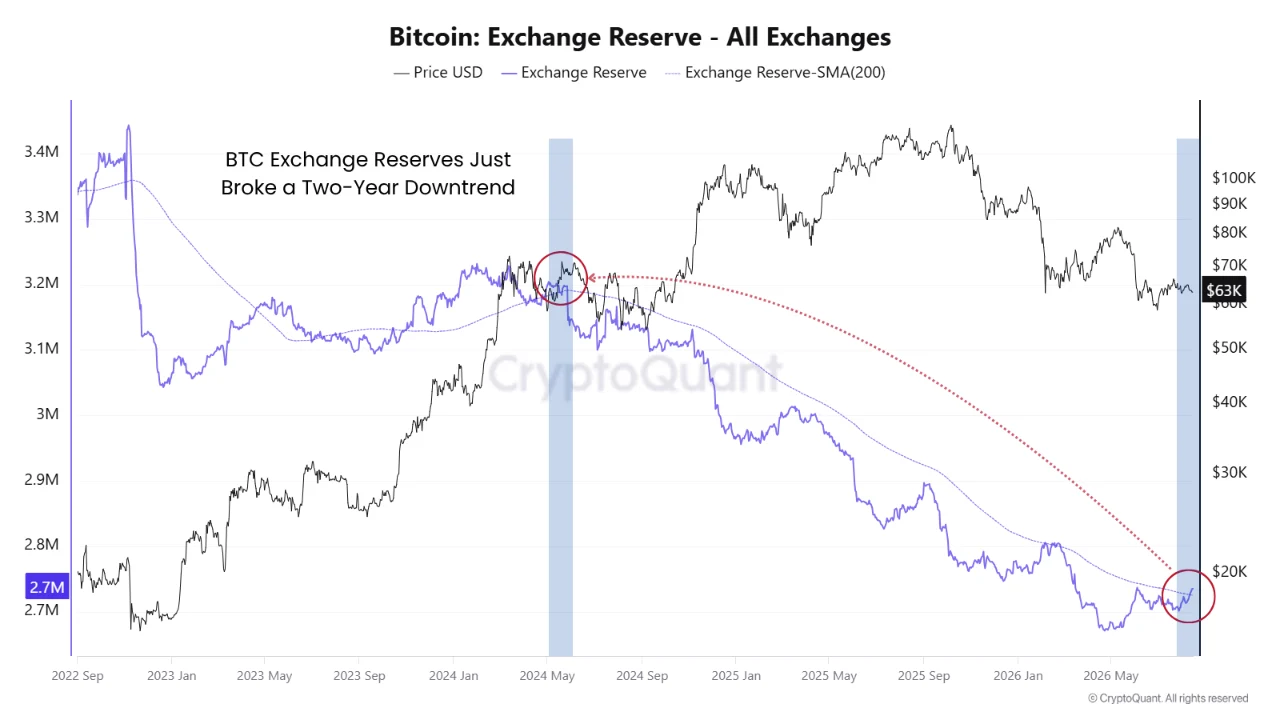
Coins held on exchanges are easier to trade, but their presence does not prove an intention to sell. They may be used as collateral, held for market-making or moved simply to preserve access to liquidity. The reserve increase represents potential supply rather than completed distribution.
The two-year reserve decline had reduced the pool of BTC immediately available on exchanges. A break in that trend weakens the exchange-level scarcity tailwind: future selling no longer depends as heavily on another large day of deposits because more inventory is already accessible.
The crossover still needs time. MorenoDV notes that an earlier move above the 200-day average lasted only a few days. Several weeks above the trend, accompanied by larger whale deposits or rising realized losses, would carry more information than the initial break alone.
READ MORE:

Dogecoin Sits at a Rare Extreme With $0.068 on the Line
ETF Outflows Leave Absorption Unproven
Those withdrawals are small relative to Bitcoin’s total market value and cannot explain the entire price move. Their direction still matters because the ETFs represent one of the market’s most transparent sources of spot demand. During the same period that exchange reserves challenged their long decline, this channel was returning capital rather than absorbing additional supply.
What Would Change the Read?
A stronger reading would require Netflow to turn negative and remain there. The August 15 reading and incomplete August 16 figure are lower but still positive, meaning exchange balances continued to receive more BTC than they lost. Repeated net outflows would begin reducing the inventory highlighted by MorenoDV and show that the reserve crossover is failing to hold.
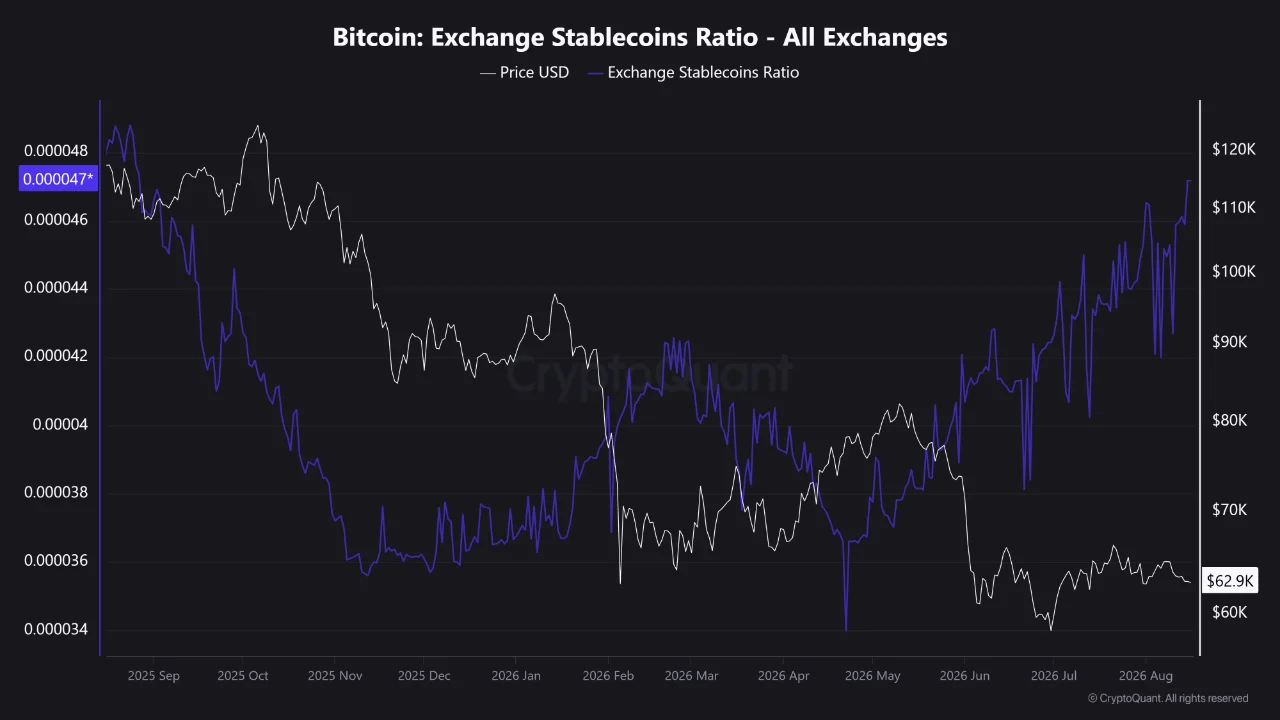
Funding would also need to remain controlled. A renewed rise in Open Interest would only become constructive if it appeared alongside stronger spot demand or ETF inflows. Open Interest by itself does not reveal whether new positions are long or short, and rebuilding leverage without cash-market support could recreate the instability that has just started to fade.
The bearish interpretation would strengthen if exchange reserves remain above their 200-day average for several weeks, ETF outflows continue and whale-to-exchange transfers or realized losses begin rising. That combination would make the case for active distribution more credible.
Heavy fresh deposits and expensive long leverage have both eased. What remains is an exchange inventory that has not yet been withdrawn or clearly absorbed. That is the line between stabilization and recovery.
On-chain and derivatives indicators can change quickly and may be affected by exchange wallet classifications, internal transfers and market structure. This article is for informational purposes only and does not constitute investment advice.