
Bitcoin had already come under pressure Friday following stronger-than-expected U.S. jobs data, while spot Bitcoin ETF inflows also cooled from the previous day’s unusually large total.
The lack of weekend action doesn’t mean the bigger Bitcoin story has gone away. Analyst Mags believes the recent recovery could resemble what happened during the 2022 bear market, when BTC initially bounced from its 200-week moving average before eventually falling toward its 300-week moving average and forming a deeper cycle low.
At the same time, not every indicator agrees that another major drop is coming. Recent ETF demand and an improving trend indicator provide bulls with a very different argument.
Mags Says Bitcoin May Have One More Major Dip
His chart compares the current Bitcoin cycle with 2022. During the previous bear market, BTC reached its 200-week moving average around August 2022 and initially bounced. That recovery didn’t mark the final bottom.
Bitcoin eventually rolled over again and reached its cycle low later that year, much closer to the 300-week moving average.
Mags sees similarities today.
The timing comparison is particularly interesting. His first 200-week MA interaction occurred around August 2022, while the current one occurred around August 2026. The previous cycle then bottomed around December 2022, and his projection places the next potential low around December 2026.
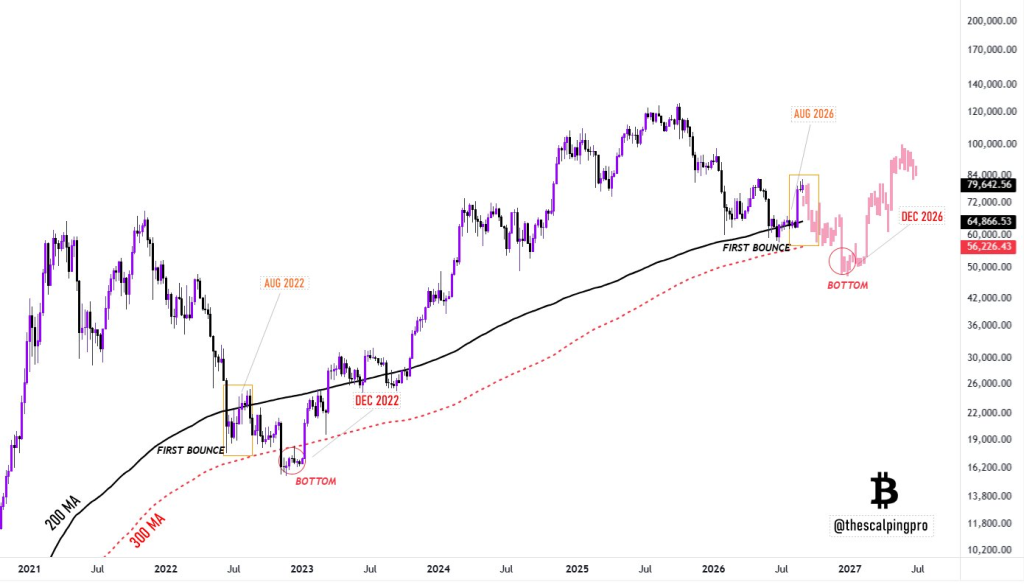
But this is a historical comparison, not a rule. Bitcoin doesn’t have to reproduce the 2022 sequence simply because the moving averages and timing look similar.
CryptoCon Also Thinks the Bitcoin Bottom May Still Be Ahead
Mags isn’t alone in expecting another leg lower.
That overlaps closely with Mags’ December scenario.
However, their downside expectations shouldn’t be treated as identical. CryptoCon has used several different models, and previous analysis has produced substantially lower potential targets, including $44,500 and $28,500, depending on which historical bear-market band Bitcoin reaches. More recent analysis has also acknowledged conflicting on-chain evidence that already resembles conditions seen around previous cycle lows.
It’s that two separate cycle analyses leave room for the current rally to be an intermediate recovery rather than the beginning of a completely new bull run.
Mags’ chart gives traders a particularly straightforward level to monitor: if Bitcoin eventually loses the 200-week MA again, the rising 300-week MA around $56,000 becomes considerably more relevant.
Read also: Crypto News Today: SEC and G20 Open the Door for Bitcoin Era With New Onchain Rules
Bitcoin Bulls Have Some Strong Evidence of Their Own
There is also a major problem with assuming another collapse is inevitable: recent market behavior has become considerably stronger.
Another bullish argument comes from Bitfinex analysts, who reportedly identified a bullish turn in Bitcoin’s weekly Super Trend indicator on September 5.
Super Trend is a volatility-based trend-following indicator. A bullish reading generally means price has moved above the indicator’s trend line and remains constructive while that relationship holds.
That creates an interesting conflict with Mags’ cycle comparison.
The long-term historical model says another major decline remains possible. More immediate market indicators say buyers have regained some control.
Bitcoin Price Could Be Entering the Most Important Part of the Cycle
Mags’ chart is compelling because the 2022 and 2026 structures share several characteristics: a major decline, contact with the 200-week MA, a strong initial rebound and a rising 300-week MA underneath.
But Bitcoin is also trading in a different market environment.
Spot ETFs have created another major source of institutional demand, and Thursday’s $730.9 million inflow demonstrates how quickly capital can return when sentiment improves. Bitcoin’s recent recovery toward $82,000 also shows that buyers remain willing to step in well above the analyst’s projected bottom.
The next few levels should help separate the two scenarios.