Dogecoin launched in December 2013 as a lighthearted, meme-inspired cryptocurrency built as a fork of Litecoin and has since grown into one of the largest and most widely traded tokens in the crypto market.
Dogecoin price today is $0.0849, down 2.8% over the past 24 hours, with a market capitalization of $13.229 billion and a 24-hour trading volume of $1.041 billion.
Live Market Data
|
Metric |
Value |
|
Price |
$0.0849 |
|
24H Change |
-2.8% |
|
24H Range |
$0.08458 – $0.09105 |
|
Market Cap |
$13.229B |
|
Fully Diluted Valuation |
$13.229B |
|
24H Trading Volume |
$1.041B |
|
Circulating Supply |
155.991B |
|
Total Supply |
155.992B |
|
Max Supply |
Infinite |
Source: market data taken from CoinGecko, as of Sep 20, 2026. Figures may vary slightly across other tracking websites.
Dogecoin Exchange Volume
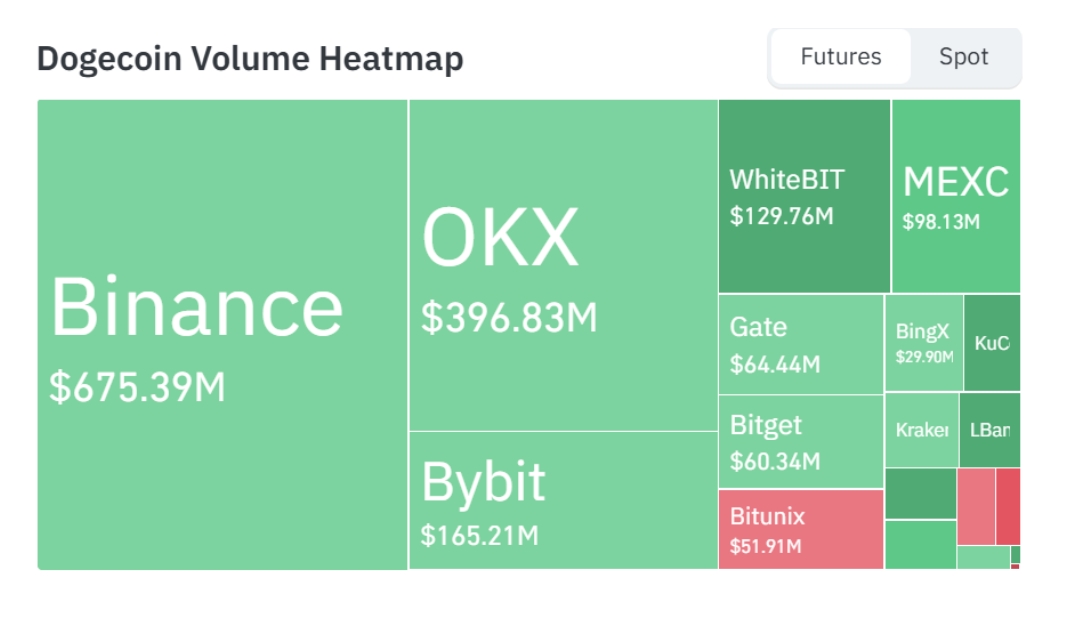
Source: Volume Heatmap Data Taken From CoinGlass, As of Sept 20, 2026.
WhiteBIT recorded $129.76 million, while MEXC processed $98.13 million over the same period. Smaller contributions came from Gate at $64.44 million, Bitget at $60.34 million, Bitunix at $51.91 million, and BingX at $29.90 million.
This volume distribution confirms DOGE remains among the most actively traded tokens in the market, even during a short-term pullback.
Dogecoin Technical Analysis
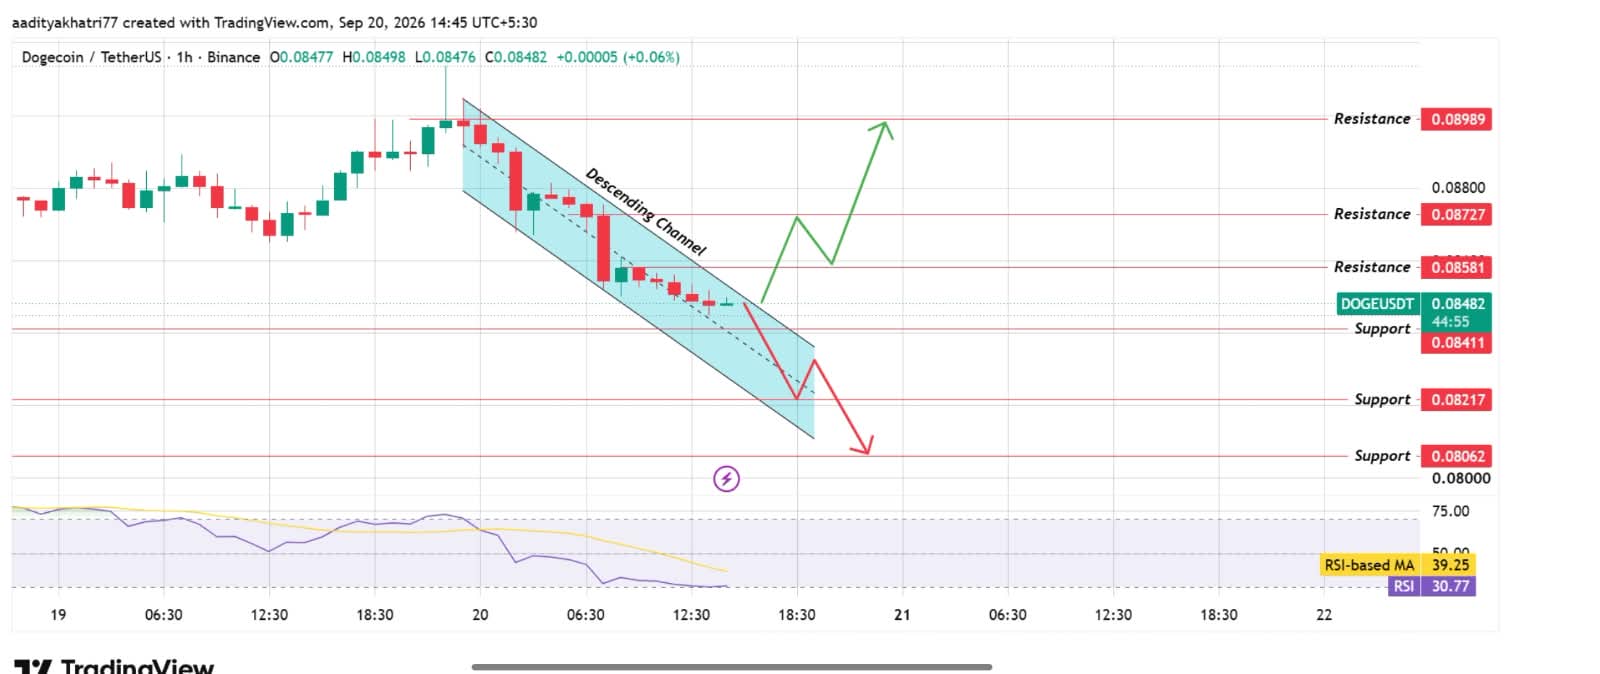
On the hourly chart, tracked against Binance data with candles closing at 14:45 UTC+5:30 on September 20, 2026, DOGE is trading inside a descending channel at $0.08482.
Price is currently testing the upper boundary of that channel after a sharp slide over the past 24 hours.
Source: Chart taken from TradingView, as of Sep 20, 2026
The Relative Strength Index reads 30.77, well below its moving average of 39.25, signaling oversold conditions that often precede a short-term bounce attempt.
This dogecoin technical analysis centers on whether that bounce can turn into a genuine breakout.
Can $DOGE Break the Descending Channel and Push Higher?
If price clears the upper boundary of the descending channel with rising volume, a confirmed hourly candle close above $0.08581 would open the path toward $0.08727, and continued strength could carry DOGE toward the $0.08989 resistance zone.
A volume-backed breakout here would mark a meaningful shift away from the current downtrend structure and represent one of the more bullish dogecoin price levels to watch this week.
What Happens If $DOGE Gets Rejected at the Channel Top?
A rejection from the upper boundary followed by a break of the channel’s lower support would shift momentum back to the downside.
A confirmed close below $0.08411 could send the price toward $0.08217, with continued selling pressure potentially reaching the $0.08062 support zone.
This scenario would extend the current descending structure rather than resolve it.
Dogecoin Support and Resistance Levels
|
Support |
Resistance |
|
$0.08411 |
$0.08581 |
|
$0.08217 |
$0.08727 |
|
$0.08062 |
$0.08989 |
Bull, Base, and Bear Scenarios
|
Scenario |
Setup |
Level |
|
Bull |
Breakout above the channel’s upper boundary with volume |
$0.08989 |
|
Base |
Price consolidates within the descending channel |
$0.08411 – $0.08581 |
|
Bear |
Rejection at resistance, break of channel support |
$0.08062 |
Dogecoin vs Bitcoin
Dogecoin’s price movement continues to closely follow Bitcoin’s broader trend, a relationship typical of large-cap altcoins with deep liquidity.
Bitcoin’s own 24-hour decline of 1.5% has weighed on risk appetite across the altcoin market, contributing to $DOGE’s sharper 2.8% pullback over the same period.
If Bitcoin stabilizes or recovers in the sessions ahead, it would likely support DOGE’s attempt to break above its descending channel, while continued Bitcoin weakness could reinforce the bearish scenario outlined above.
Methodology
This dogecoin price prediction is based on hourly chart data sourced from Binance via TradingView, combined with live market data from CoinMarketCap and exchange volume figures from Coinglass.
Support and resistance levels are drawn directly from price reactions visible on the descending channel structure. No liquidation or news data was available for this analysis, so those sections have been omitted rather than estimated.
This dogecoin price prediction 2026 outlook will be updated as the channel structure develops further.
Expert Opinion
Market commentary around Dogecoin’s current setup has focused on the tension between short-term oversold conditions and the broader downtrend still in place on the hourly chart.
Analysts note that an RSI reading near 30 often attracts dip buyers, but caution that a genuine trend reversal typically requires a confirmed close above the channel’s upper boundary rather than a temporary wick into resistance.
The general view is that volume will be the deciding factor in whether this bounce becomes a breakout.
Disclaimer: This article is for informational purposes only and does not constitute financial advice. Cryptocurrency prices are highly volatile, and $DOGE could move in either direction regardless of the scenarios outlined above. Actual price movement may fall short of, or exceed, the levels discussed, and downside risk should be weighed carefully before making any investment decision.