
Market analyst Sunil Reddy, known online as Macro Liquidity by Sunil Reddy, believes the answer is not found on the gold chart itself. Instead, he argues that investors should focus on two key macro indicators that have played a major role in precious metals performance for years.
Sunil Reddy recently explained that gold and silver remain highly sensitive to front end U.S. Treasury yields and the Dollar Index.
His focus is on the U.S. 2 Year Treasury yield. That yield remains relatively strong despite recent market volatility. Sunil Reddy expects the 2 Year yield could still move toward 4.45% before forming a meaningful top.
When will Gold and Silver bottom again?The answer is not on the Gold chart.
It is in the US 2-Year Yield and Dollar Index.
Gold and Silver are highly sensitive to front-end yields, and right now the 2Y yield is still looking strong.
I would expect at least a move toward… pic.twitter.com/mIAgwO3wZ7
— Macro Liquidity by Sunil Reddy (@Macrobysunil) June 5, 2026
The Dollar Index is another important piece of the puzzle. A firm U.S. dollar often creates additional pressure on gold and silver prices because both metals are priced globally in dollars.
Sunil Reddy believes this combination of elevated yields and a strong Dollar Index means short term weakness in the gold price and silver price could continue for several more weeks.
Despite that outlook, he does not view the current decline as a reason for panic. His position is that this period represents an accumulation window instead of a warning sign for long term investors.
The Exact Macro Signal Sunil Reddy Is Waiting To See
The analyst says the key signal has not appeared yet.
Sunil Reddy is watching for both the U.S. 2 Year yield and the Dollar Index to begin forming topping and reversal structures. Once those indicators start turning lower, pressure on gold and silver could begin to ease.
That signal would indicate that financial conditions are becoming more favorable for precious metals.
His strategy is straightforward. He plans to continue treating current weakness as an opportunity to build positions and expects to be fully invested in gold and silver by the end of this pressure phase.
The logic is rooted in the historical relationship between bond yields, the U.S. dollar, and precious metals. Previous cycles have often shown gold and silver performing well after yields and the dollar lose strength.
Read Also: Bloomberg Analyst Warns: Gold and Silver Prices May Have Already Peaked in 2026
Gold Price Pullback Follows A Historic Rally Earlier This Year
The gold price experienced extraordinary volatility during the first half of 2026.
Gold reached a record high of $5,589 per ounce in January before a sharp correction followed. Profit taking accelerated during March and produced a decline of roughly 10%, which became the steepest monthly drop for gold in more than a decade.
Additional pressure came from higher margin requirements introduced by CME Group. Those changes reduced some of the speculative activity that had driven the earlier rally.
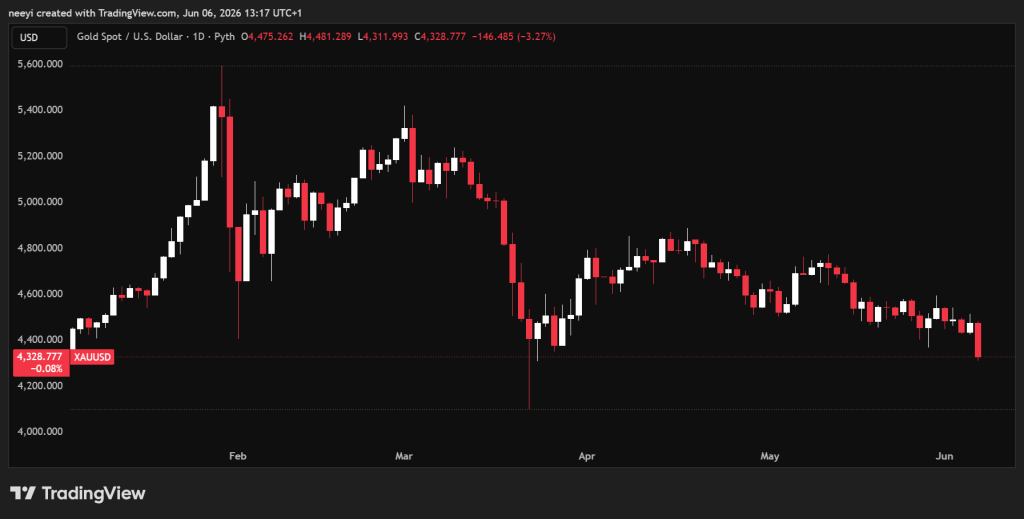
Gold now trades near $4,300 per ounce. The metal has fallen 6.79% during the past month alone.
Recent U.S. employment data added another challenge. Stronger than expected payroll figures increased expectations that interest rates could stay elevated for longer. Higher rate expectations often support both Treasury yields and the U.S. dollar, which creates a difficult environment for gold.
Several Factors Could Support A Gold Price Recovery Later In 2026
Current weakness has not changed the broader bullish outlook held by many analysts and institutions.
Central bank demand remains one of the most important support factors for the gold price. Countries such as Turkey, Poland, and India have remained active buyers in recent years.
Long term charts also show that the broader uptrend that began in 2019 remains intact despite the correction.
Another factor worth watching is inflation and geopolitical risk. Lower inflation readings could pull bond yields down. Geopolitical uncertainty could also increase safe haven demand for gold.
Read Also:
Silver Price Could Benefit Even More If Gold Finds A Bottom
Silver has experienced an even more dramatic year.
Recent weakness came from two major sources. Strong U.S. economic data pressured macro assets across the board. A broader decline in industrial metals such as copper also weighed on sentiment toward silver.
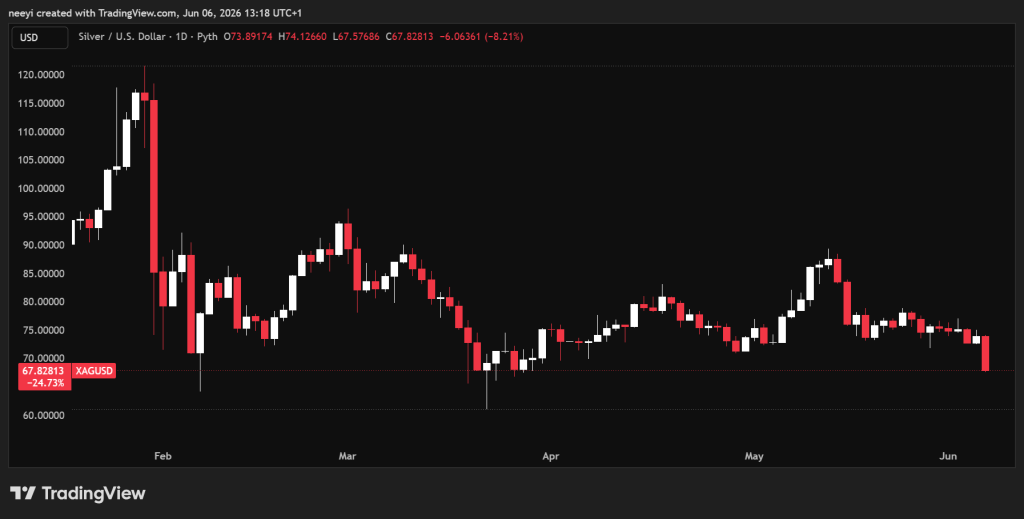
Many analysts believe silver could outperform gold once conditions improve.
The gold-to-silver ratio has narrowed considerably this year. Historical patterns often show silver delivering larger percentage moves after gold begins a sustained recovery.
Supply fundamentals also remain supportive. Silver is now facing its fifth consecutive year of global supply deficits. Industrial demand continues to grow, particularly from solar energy production, where silver remains a critical component.
J.P. Morgan expects silver to average between $81 and $85 per ounce later this year if supply conditions remain tight.