Key Facts:
• Bitcoin trades at $77,225 with a $1.55trn market cap, down 38% from a 12-month high of $124,740 — CoinGecko, 22 August 2026
• Polymarket’s “What price will Bitcoin hit in 2026?” carries $57.2m in volume and prices $100,000 at 26.0% — Polymarket, 22 August 2026
• The same market prices a dip to $50,000 at 20.5% and a dip to $55,000 at 24.5% — Polymarket, 22 August 2026
• $1.74bn of crypto short positions were liquidated in 24 hours on 19 August 2026, the second-largest such event on record — Forbes, 20 August 2026
• The US Treasury will at least double long-bond buybacks from $2bn to $4bn per operation, effective 9 September 2026 — US Treasury, 19 August 2026
• Citigroup has cut its Bitcoin target twice in 2026, from $143,000 to an $82,000 base case with a $53,000 bear case — Citigroup via CoinGecko, August 2026

What actually moved Bitcoin off the floor
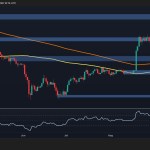
The rally that took Bitcoin from a 12-month low of $58,566 back to $77,225 was not a crypto-native event. It was a rates event that crypto happened to be positioned badly for.
On 19 August 2026 the US Treasury announced it would at least double its long-term bond buyback operations, lifting them from $2bn to a minimum of $4bn per operation across 10-to-30-year securities, effective 9 September. A buyback reduces the available supply of those bonds and pushes their yields down. Lower long-duration yields make risk-free government debt less attractive relative to everything else, which mechanically pushes capital along the risk curve — into equities, and into assets like Bitcoin that trade as a long-duration bet on liquidity.
Cathie Wood, chief executive officer at ARK Invest, has argued Bitcoin “seems to be in a bottoming process” and will “resume the very volatile but broad uptrend.” That is a defensible reading of a market that has stopped making new lows. It is also, notably, a statement about process rather than price — and the distance between “bottoming process” and “$150,000 by December” is the entire subject of this article.
What the institutions are actually forecasting, and how the market grades them
On the bullish side, Tom Lee of Fundstrat holds $200,000–$250,000, the most aggressive number from a major shop and one he has held through a 50% drawdown. JPMorgan carries $150,000–$170,000. Bernstein sits at $150,000, revised down from $200,000 in June 2026. Standard Chartered’s Geoff Kendrick moved to $100,000 from $150,000, having earlier called Bitcoin “near $64K a screaming buy.” Fundstrat’s Sean Farrell is at roughly $115,000, and Fidelity’s Jurrien Timmer describes a $65,000–$75,000 consolidation range, which is not a bull case at all — it sits below spot.
On the bearish side, Citigroup runs an $82,000 base case with a $53,000 bear case. NYDIG has floated $38,000–$39,000 around October 2026, explicitly framed as “a scenario, not a base-case forecast.” Veteran chartist Peter Brandt has pointed as low as $25,000.
Now overlay Polymarket’s implied probabilities for the same year-end window:
| Published target | House | Market-implied odds | Roughly |
|---|---|---|---|
| $200,000–$250,000 | Fundstrat (Tom Lee) | 2.1% – 1.4% | 1-in-48 to 1-in-71 |
| $150,000–$170,000 | JPMorgan | 3.4% | 1-in-29 |
| $150,000 | Bernstein | 3.4% | 1-in-29 |
| $115,000 | Fundstrat (Sean Farrell) | ~14% | 1-in-7 |
| $100,000 | Standard Chartered | 26.0% | 1-in-4 |
| $82,000 base | Citigroup | ~75% | 3-in-4 |
| $53,000 bear | Citigroup | ~22% | 1-in-5 |
| $38,000–$39,000 | NYDIG | ~7% | 1-in-14 |
| $25,000 | Peter Brandt | 2.5% | 1-in-40 |
The on-chain and flow picture beneath the price
Price is the noisiest signal Bitcoin produces. The supply-side data has been telling a steadier story.
Here is the synthesis those two data sets produce that neither states on its own. The market assigns an 82.5% probability to Bitcoin touching $80,000 and a 62.5% probability to it touching $85,000 at some point before year-end. It assigns 26.0% to $100,000. In other words, the crowd is highly confident about a further grind of 3% to 10% higher, and genuinely unconvinced about anything beyond that. That is not the shape of a market expecting a new bull run. It is the shape of a market expecting a range — precisely the outcome Fidelity’s Jurrien Timmer described, and one that would leave almost every headline target unmet while nothing dramatic appears to happen.
The regulatory variable nobody can price
The tension running underneath 2026 is that Bitcoin’s macro sensitivity has risen just as its regulatory environment has become more accommodating, and the two forces do not net out cleanly.
Rule changes that widen institutional access are structurally bullish on a multi-year horizon and almost irrelevant on a four-month one. An asset manager granted permission to allocate in September does not deploy in September. This is the mismatch that trips up year-end forecasting: the catalysts most often cited for six-figure targets operate on timelines longer than the target’s own deadline.
The reverse is also true, and it is the more immediate risk. Bitcoin now trades as a high-beta expression of dollar liquidity. The Treasury buyback expansion that lit the current rally is a liquidity event, and liquidity events reverse. If long-end yields back up — because inflation prints hot, because issuance surprises, because the buyback programme is trimmed — the same channel that pushed capital into Bitcoin pushes it straight back out. Nothing about Bitcoin’s own fundamentals changes; the discount rate does.
What happens next: three predictions with reasoning
The defensible position on Bitcoin at $77,225 is not bullish or bearish. It is that the distribution is close to symmetric — 26% to $100,000, 20.5% to $50,000 — and that anyone quoting you a single number for year-end is selling conviction the data does not support.
FAQ
A: The largest live prediction market gives an 82.5% chance Bitcoin touches $80,000, 26.0% for $100,000 and 20.5% for a dip to $50,000. A range of roughly $55,000 to $95,000 covers the bulk of the probability mass, with genuine tails on both sides.
A: Because it requires a 29.5% rally in about four months from an asset that has spent a year making lower highs. The market is confident about a small grind higher and unconvinced beyond that, which is why probabilities fall sharply above $100,000 — to 10.5% at $120,000 and 3.4% at $150,000.
A: Most plausibly a reversal in the liquidity conditions that drove the August rally — a back-up in long-end Treasury yields — or forced selling from a corporate treasury holder. Both are exogenous to Bitcoin itself, which is what distinguishes this cycle’s downside risk from earlier ones.
A: Bank targets are periodic publications revised on a research calendar; prediction market prices reprice continuously against money at risk. In 2026 that gap has been directional: Bernstein, Standard Chartered and Citigroup all cut their targets after spot fell, not before.
A: The evidence points to a positioning event rather than a demand event. $1.74bn of shorts were liquidated in 24 hours, the second-largest such episode on record, and a squeeze ends when the shorts are exhausted. Durable uptrends are built on sustained inflows, which have not yet appeared at comparable scale.
A: The 30-year US Treasury yield. Bitcoin’s August move came directly from the Treasury’s buyback expansion compressing long-end yields, and the same transmission channel runs in reverse. Watching it is more informative than watching crypto-native metrics for this particular setup.
This article is analysis and information only. It is not investment advice, and no part of it is a recommendation to buy or sell any asset. Prediction market probabilities are the market’s view at a point in time, not a forecast by FinanceFeeds. Figures cited were accurate on 22 August 2026.